Benford’s law in our data
A few months back our team found out about an interesting statistical phenomena known as the Benford’s law. This law is an observation about the frequency distribution of leading significant digits in real-life sets of numerical data.
Let’s say we have a big bag of numbers describing some natural phenomenon and we want to answer the question:
What’s the probability of picking a number from the bag that starts with the digit “1”?
The most obvious answer would be:
Same as picking a number that starts with the digit “2”, or digit “3”, or, as a matter of fact, any other digit.
This would mean that the frequency distribution of the leading significant digits in a set of numbers describing natural phenomenon is uniform and that each digit occurs as the first digit roughly about 11.1% of the time. Well, Frank Benford would not agree.
The Benford’s law states that if we take a large enough set of numbers describing some natural phenomena, most of the numbers in the set will start with the digit “1” (30.1%), followed by the number of occurrences of the numbers that starts with the digit “2” (17.6%), than with “3” (12.5%) and so on, with the percentage of occurrences of the digit “9” being under 5% (4.6%). The distribution of the starting digits, according to the Benford’s law, can be seen in Figure 1.
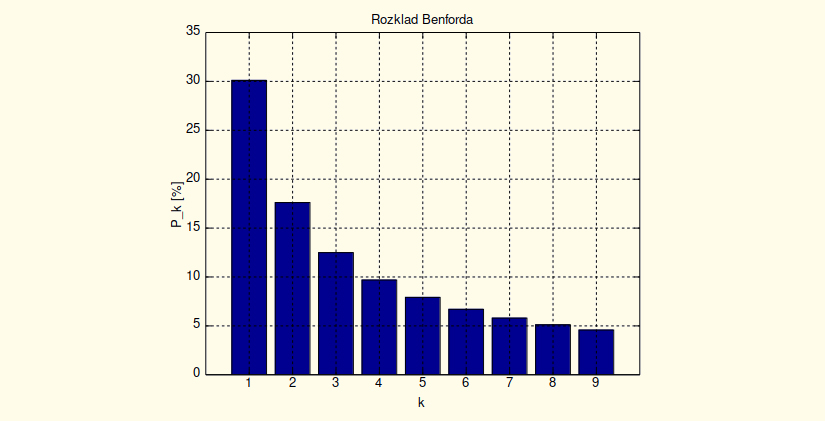
Figure 1: The distribution of first digits, according to Benford’s law.
Even though it sounds mind blowing, it’s been proven that this law applies to numerous real-life numerical data sets and that it can be used as a powerful tool in analytics and anomaly detection. Some notable examples that obey the Benford’s law:
- financial statements
- city populations
- world river lengths
- natural phenomenon such as depths of earthquakes
- number of daily reported new cases of COVID-19
Since we were so intrigued by this phenomenon, we assumed there would be cases where this law applied to our data. And guess what – we were right!
We compiled 3 different sets of numbers for the data for 15th of March (we have ~130M events daily) and tested Benford’s law on them.
For the first set, we counted how many impressions per user we had, and then we counted how many times every digit occurred as the leading digit in that number (Figure 2).
For the second data set we counted the number of ad requests per each city, and then, again, we took the first digit from every count we got, and counted the occurrences of ones, twos, etc. (Figure 3).
The results we got were astonishing. Here are the graphs:
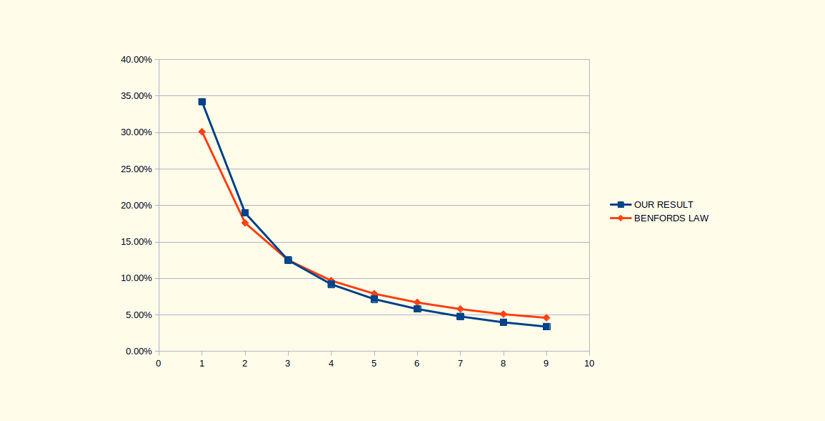
Figure 2: The distribution of the significant digits in number of impressions per user on the 15th of March
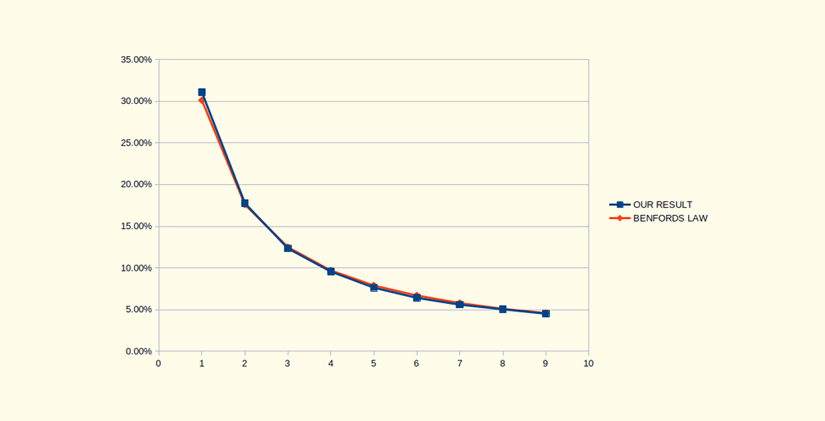
Figure 3: The distribution of first digits in number of ad requests per city on the 15th of March
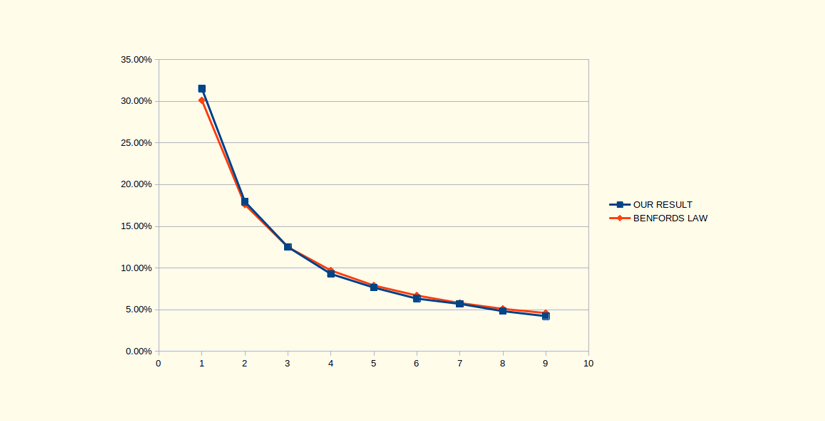
Figure 4: The distribution of first digits in number of auction bids per creative on the 15th of March
After that, we were convinced that the law applied to our system. And we were glad, because it meant that the system was behaving as it should. Anyway, in some industries, such as banking, Benford’s law is used for detecting malpractices, such as fraud. It is even admissible as evidence in the US criminal court.
There are, however, some constraints as to what kinds of data sets follow the law:
- there are no pre-established minimum or maximum values
- the numbers are not identifiers, such as auto-incrementing ids in a database table
- the median is greater than the mean, but the numbers are not close to the mean in general
- the numbers are spanning across multiple orders of magnitude, otherwise the data might be biased
There is no doubt that Benford’s law had us drop our jaws when we noticed that it is applicable to our data. It is definitely something that we are going to dig deeper into in the future.
We could not wait to share our fascination with the Benford’s law with you. It would also be awesome if you shared your stories about the ways you applied this law to your datasets.

Written by
Dragan Ilić, Dragan Živković
Data Engineering